האקראי הוא מודול הקיים בספריית NumPy. מודול זה מכיל את הפונקציות המשמשות להפקת מספרים אקראיים. מודול זה מכיל כמה שיטות פשוטות להפקת נתונים אקראיים, כמה פונקציות תמורה והפצה ופונקציות מחולל אקראיות.
כל הפונקציות במודול אקראי הן כדלקמן:
נתונים אקראיים פשוטים
יש את הפונקציות הבאות של נתונים אקראיים פשוטים:
1) p.random.rand(d0, d1, ..., dn)
פונקציה זו של מודול אקראי משמשת ליצירת מספרים או ערכים אקראיים בצורה נתונה.
דוגמא:
import numpy as np a=np.random.rand(5,2) a
תְפוּקָה:
array([[0.74710182, 0.13306399], [0.01463718, 0.47618842], [0.98980426, 0.48390004], [0.58661785, 0.62895758], [0.38432729, 0.90384119]])
2) np.random.randn(d0,d1, ...,dn)
פונקציה זו של מודול אקראי מחזירה מדגם מההתפלגות ה'רגילה הרגילה'.
דוגמא:
import numpy as np a=np.random.randn(2,2) a
תְפוּקָה:
array([[ 1.43327469, -0.02019121], [ 1.54626422, 1.05831067]]) b=np.random.randn() b -0.3080190768904835
3) np.random.randint(low[, high, size, dtype])
פונקציה זו של מודול אקראי משמשת ליצירת מספרים שלמים אקראיים מכלל (נמוך) לבלעדי (גבוה).
דוגמא:
import numpy as np a=np.random.randint(3, size=10) a
תְפוּקָה:
array([1, 1, 1, 2, 0, 0, 0, 0, 0, 0])
4) np.random.random_integers(נמוך[, גבוה, גודל])
פונקציה זו של מודול אקראי משמשת ליצירת מספרים שלמים אקראיים מסוג np.int בין נמוך לגבוה.
דוגמא:
import numpy as np a=np.random.random_integers(3) a b=type(np.random.random_integers(3)) b c=np.random.random_integers(5, size=(3,2)) c
תְפוּקָה:
2 array([[1, 1], [2, 5], [1, 3]])
5) np.random.random_sample([גודל])
פונקציה זו של מודול אקראי משמשת ליצירת מספר צפים אקראי במרווח החצי-פתוח [0.0, 1.0).
דוגמא:
import numpy as np a=np.random.random_sample() a b=type(np.random.random_sample()) b c=np.random.random_sample((5,)) c
תְפוּקָה:
0.09250360565571492 array([0.34665418, 0.47027209, 0.75944969, 0.37991244, 0.14159746])
6) np.random.random([גודל])
פונקציה זו של מודול אקראי משמשת ליצירת מספר צפים אקראי במרווח החצי-פתוח [0.0, 1.0).
דוגמא:
import numpy as np a=np.random.random() a b=type(np.random.random()) b c=np.random.random((5,)) c
תְפוּקָה:
0.008786953974334155 array([0.05530122, 0.59133394, 0.17258794, 0.6912388 , 0.33412534])
7) np.random.ranf([גודל])
פונקציה זו של מודול אקראי משמשת ליצירת מספר צפים אקראי במרווח החצי-פתוח [0.0, 1.0).
דוגמא:
import numpy as np a=np.random.ranf() a b=type(np.random.ranf()) b c=np.random.ranf((5,)) c
תְפוּקָה:
0.2907792098474542 array([0.34084881, 0.07268237, 0.38161256, 0.46494681, 0.88071377])
8) np.random.sample([size])
פונקציה זו של מודול אקראי משמשת ליצירת מספר צפים אקראי במרווח החצי-פתוח [0.0, 1.0).
דוגמא:
import numpy as np a=np.random.sample() a b=type(np.random.sample()) b c=np.random.sample((5,)) c
תְפוּקָה:
0.012298209913766511 array([0.71878544, 0.11486169, 0.38189074, 0.14303308, 0.07217287])
9) np.random.choice(a[, size, replace, p])
פונקציה זו של מודול אקראי משמשת ליצירת מדגם אקראי ממערך 1-D נתון.
דוגמא:
import numpy as np a=np.random.choice(5,3) a b=np.random.choice(5,3, p=[0.2, 0.1, 0.4, 0.2, 0.1]) b
תְפוּקָה:
array([0, 3, 4]) array([2, 2, 2], dtype=int64)
10) np.random.bytes(length)
פונקציה זו של מודול אקראי משמשת ליצירת בתים אקראיים.
דוגמא:
import numpy as np a=np.random.bytes(7) a
תְפוּקָה:
'nQx08x83xf9xdex8a'
תמורות
יש את הפונקציות הבאות של תמורות:
1) np.random.shuffle()
פונקציה זו משמשת לשינוי רצף במקום על ידי ערבוב תוכנו.
דוגמא:
import numpy as np a=np.arange(12) a np.random.shuffle(a) a
תְפוּקָה:
array([ 0, 1, 2, 3, 4, 5, 6, 7, 8, 9, 10, 11]) array([10, 3, 2, 4, 5, 8, 0, 9, 1, 11, 7, 6])
2) np.random.permutation()
פונקציה זו מחזירה רצף באופן אקראי או מחזירה טווח משוקלל.
דוגמא:
import numpy as np a=np.random.permutation(12) a
תְפוּקָה:
array([ 8, 7, 3, 11, 6, 0, 9, 10, 2, 5, 4, 1])
הפצות
יש את הפונקציות הבאות של תמורות:
1) beta(a, b[, size])
פונקציה זו משמשת כדי לצייר דגימות מהתפלגות בטא.
דוגמא:
def setup(self): self.dist = dist.beta self.cargs = [] self.ckwd = dict(alpha=2, beta=3) self.np_rand_fxn = numpy.random.beta self.np_args = [2, 3] self.np_kwds = dict()
2) binomial(n, p[, גודל])
פונקציה זו משמשת לציור מדגם מהתפלגות בינומית.
דוגמא:
import numpy as np n, p = 10, .6 s1= np.random.binomial(n, p, 10) s1
תְפוּקָה:
array([6, 7, 7, 9, 3, 7, 8, 6, 6, 4])
3) chisquare(df[, size])
פונקציה זו משמשת לציור מדגם מהתפלגות בינומית.
דוגמא:
import numpy as np np.random.chisquare(2,4) sum(np.random.binomial(9, 0.1, 20000) == 0)/20000.
תְפוּקָה:
array([6, 7, 7, 9, 3, 7, 8, 6, 6, 4])
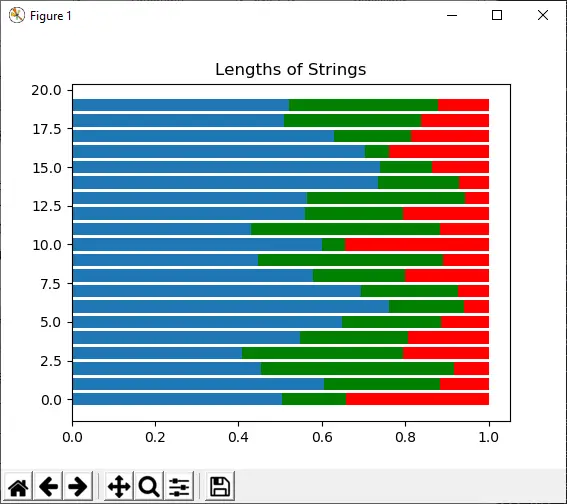
4) dirichlet(אלפא[, גודל])
פונקציה זו משמשת לציור מדגם מהתפלגות Dirichlet.
דוגמא:
Import numpy as np import matplotlib.pyplot as plt s1 = np.random.dirichlet((10, 5, 3), 20).transpose() plt.barh(range(20), s1[0]) plt.barh(range(20), s1[1], left=s1[0], color='g') plt.barh(range(20), s1[2], left=s1[0]+s1[1], color='r') plt.title('Lengths of Strings') plt.show()
תְפוּקָה:
5) אקספוננציאלי([קנה מידה, גודל])
פונקציה זו משמשת כדי לצייר מדגם מהתפלגות מעריכית.
דוגמא:
def __init__(self, sourceid, targetid): self.__type = 'Transaction' self.id = uuid4() self.source = sourceid self.target = targetid self.date = self._datetime.date(start=2015, end=2019) self.time = self._datetime.time() if random() <0.05: self.amount="self._numbers.between(100000," 1000000) if random() < 0.15: self.currency="self._business.currency_iso_code()" else: pre> <p> <strong>6) f(dfnum, dfden[, size])</strong> </p> <p>This function is used to draw sample from an F distribution.</p> <p> <strong>Example:</strong> </p> <pre> import numpy as np dfno= 1. dfden = 48. s1 = np.random.f(dfno, dfden, 10) np.sort(s1) </pre> <p> <strong>Output:</strong> </p> <pre> array([0.00264041, 0.04725478, 0.07140803, 0.19526217, 0.23979 , 0.24023478, 0.63141254, 0.95316446, 1.40281789, 1.68327507]) </pre> <p> <strong>7) gamma(shape[, scale, size])</strong> </p> <p>This function is used to draw sample from a Gamma distribution </p> <p> <strong>Example:</strong> </p> <pre> import numpy as np shape, scale = 2., 2. s1 = np.random.gamma(shape, scale, 1000) import matplotlib.pyplot as plt import scipy.special as spss count, bins, ignored = plt.hist(s1, 50, density=True) a = bins**(shape-1)*(np.exp(-bins/scale) / (spss.gamma(shape)*scale**shape)) plt.plot(bins, a, linewidth=2, color='r') plt.show() </pre> <img src="//techcodeview.com/img/numpy-tutorial/36/numpy-random-python-2.webp" alt="numpy.random in Python"> <p> <strong>8) geometric(p[, size])</strong> </p> <p>This function is used to draw sample from a geometric distribution. </p> <p> <strong>Example:</strong> </p> <pre> import numpy as np a = np.random.geometric(p=0.35, size=10000) (a == 1).sum() / 1000 </pre> <p> <strong>Output:</strong> </p> <pre> 3. </pre> <p> <strong>9) gumbel([loc, scale, size])</strong> </p> <p>This function is used to draw sample from a Gumble distribution.</p> <p> <strong>Example:</strong> </p> <pre> import numpy as np lov, scale = 0, 0.2 s1 = np.random.gumbel(loc, scale, 1000) import matplotlib.pyplot as plt count, bins, ignored = plt.hist(s1, 30, density=True) plt.plot(bins, (1/beta)*np.exp(-(bins - loc)/beta)* np.exp( -np.exp( -(bins - loc) /beta) ),linewidth=2, color='r') plt.show() </pre> <p> <strong>Output:</strong> </p> <img src="//techcodeview.com/img/numpy-tutorial/36/numpy-random-python-3.webp" alt="numpy.random in Python"> <p> <strong>10) hypergeometric(ngood, nbad, nsample[, size])</strong> </p> <p>This function is used to draw sample from a Hypergeometric distribution. </p> <p> <strong>Example:</strong> </p> <pre> import numpy as np good, bad, samp = 100, 2, 10 s1 = np.random.hypergeometric(good, bad, samp, 1000) plt.hist(s1) plt.show() </pre> <p> <strong>Output:</strong> </p> <pre> (array([ 13., 0., 0., 0., 0., 163., 0., 0., 0., 824.]), array([ 8. , 8.2, 8.4, 8.6, 8.8, 9. , 9.2, 9.4, 9.6, 9.8, 10. ]), <a 10 list of patch objects>) </a></pre> <p><img src="//techcodeview.com/img/numpy-tutorial/36/numpy-random-python-4.webp" alt="numpy.random in Python"></p> <p> <strong>11) laplace([loc, scale, size])</strong> </p> <p>This function is used to draw sample from the Laplace or double exponential distribution with specified location and scale.</p> <p> <strong>Example:</strong> </p> <pre> import numpy as np location, scale = 0., 2. s = np.random.laplace(location, scale, 10) s </pre> <p> <strong>Output:</strong> </p> <pre> array([-2.77127948, -1.46401453, -0.03723516, -1.61223942, 2.29590691, 1.74297722, 1.49438411, 0.30325513, -0.15948891, -4.99669747]) </pre> <p> <strong>12) logistic([loc, scale, size])</strong> </p> <p>This function is used to draw sample from logistic distribution. </p> <p> <strong>Example:</strong> </p> <pre> import numpy as np import matplotlib.pyplot as plt location, scale = 10, 1 s1 = np.random.logistic(location, scale, 10000) count, bins, ignored = plt.hist(s1, bins=50) count bins ignored plt.show() </pre> <p> <strong>Output:</strong> </p> <pre> array([1.000e+00, 1.000e+00, 1.000e+00, 0.000e+00, 1.000e+00, 1.000e+00, 1.000e+00, 5.000e+00, 7.000e+00, 1.100e+01, 1.800e+01, 3.500e+01, 5.300e+01, 6.700e+01, 1.150e+02, 1.780e+02, 2.300e+02, 3.680e+02, 4.910e+02, 6.400e+02, 8.250e+02, 9.100e+02, 9.750e+02, 1.039e+03, 9.280e+02, 8.040e+02, 6.530e+02, 5.240e+02, 3.380e+02, 2.470e+02, 1.650e+02, 1.150e+02, 8.500e+01, 6.400e+01, 3.300e+01, 1.600e+01, 2.400e+01, 1.400e+01, 4.000e+00, 5.000e+00, 2.000e+00, 2.000e+00, 1.000e+00, 1.000e+00, 0.000e+00, 1.000e+00, 0.000e+00, 0.000e+00, 0.000e+00, 1.000e+00]) array([ 0.50643911, 0.91891814, 1.33139717, 1.7438762 , 2.15635523, 2.56883427, 2.9813133 , 3.39379233, 3.80627136, 4.2187504 , 4.63122943, 5.04370846, 5.45618749, 5.86866652, 6.28114556, 6.69362459, 7.10610362, 7.51858265, 7.93106169, 8.34354072, 8.75601975, 9.16849878, 9.58097781, 9.99345685, 10.40593588, 10.81841491, 11.23089394, 11.64337298, 12.05585201, 12.46833104, 12.88081007, 13.2932891 , 13.70576814, 14.11824717, 14.5307262 , 14.94320523, 15.35568427, 15.7681633 , 16.18064233, 16.59312136, 17.00560039, 17.41807943, 17.83055846, 18.24303749, 18.65551652, 19.06799556, 19.48047459, 19.89295362, 20.30543265, 20.71791168, 21.13039072]) <a 50 list of patch objects> </a></pre> <p><img src="//techcodeview.com/img/numpy-tutorial/36/numpy-random-python-5.webp" alt="numpy.random in Python"></p> <p> <strong>13) lognormal([mean, sigma, size])</strong> </p> <p>This function is used to draw sample from a log-normal distribution.</p> <p> <strong>Example:</strong> </p> <pre> import numpy as np mu, sigma = 2., 1. s1 = np.random.lognormal(mu, sigma, 1000) import matplotlib.pyplot as plt count, bins, ignored = plt.hist(s1, 100, density=True, ) a = np.linspace(min(bins), max(bins), 10000) pdf = (np.exp(-(np.log(a) - mu)**2 / (2 * sigma**2))/ (a * sigma * np.sqrt(2 * np.pi))) plt.plot(a, pdf, linewidth=2, color='r') plt.axis('tight') plt.show() </pre> <p> <strong>Output:</strong> </p> <img src="//techcodeview.com/img/numpy-tutorial/36/numpy-random-python-6.webp" alt="numpy.random in Python"> <p> <strong>14) logseries(p[, size])</strong> </p> <p>This function is used to draw sample from a logarithmic distribution. </p> <p> <strong>Example:</strong> </p> <pre> import numpy as np x = .6 s1 = np.random.logseries(x, 10000) count, bins, ignored = plt.hist(s1) def logseries(k, p): return -p**k/(k*log(1-p)) plt.plot(bins, logseries(bins, x)*count.max()/logseries(bins, a).max(), 'r') plt.show() </pre> <p> <strong>Output:</strong> </p> <img src="//techcodeview.com/img/numpy-tutorial/36/numpy-random-python-7.webp" alt="numpy.random in Python"> <p> <strong>15) multinomial(n, pvals[, size])</strong> </p> <p>This function is used to draw sample from a multinomial distribution. </p> <p> <strong>Example:</strong> </p> <pre> import numpy as np np.random.multinomial(20, [1/6.]*6, size=1) </pre> <p> <strong>Output:</strong> </p> <pre> array([[4, 2, 5, 5, 3, 1]]) </pre> <p> <strong>16) multivariate_normal(mean, cov[, size, ...)</strong> </p> <p>This function is used to draw sample from a multivariate normal distribution. </p> <p> <strong>Example:</strong> </p> <pre> import numpy as np mean = (1, 2) coveriance = [[1, 0], [0, 100]] import matplotlib.pyplot as plt a, b = np.random.multivariate_normal(mean, coveriance, 5000).T plt.plot(a, b, 'x') plt.axis('equal'023 030 ) plt.show() </pre> <p> <strong>Output:</strong> </p> <img src="//techcodeview.com/img/numpy-tutorial/36/numpy-random-python-8.webp" alt="numpy.random in Python"> <p> <strong>17) negative_binomial(n, p[, size])</strong> </p> <p>This function is used to draw sample from a negative binomial distribution. </p> <p> <strong>Example:</strong> </p> <pre> import numpy as np s1 = np.random.negative_binomial(1, 0.1, 100000) for i in range(1, 11): probability = sum(s1 <i) 36 100000. print i, 'wells drilled, probability of one success=", probability </pre> <p> <strong>Output:</strong> </p> <pre> 1 wells drilled, probability of one success = 0 2 wells drilled, probability of one success = 0 3 wells drilled, probability of one success = 0 4 wells drilled, probability of one success = 0 5 wells drilled, probability of one success = 0 6 wells drilled, probability of one success = 0 7 wells drilled, probability of one success = 0 8 wells drilled, probability of one success = 0 9 wells drilled, probability of one success = 0 10 wells drilled, probability of one success = 0 </pre> <p > <strong>18) noncentral_chisquare(df, nonc[, size])</strong> </p> <p>This function is used to draw sample from a noncentral chi-square distribution. </p> <p> <strong>Example:</strong> </p> <pre> import numpy as np import matplotlib.pyplot as plt val = plt.hist(np.random.noncentral_chisquare(3, 25, 100000), bins=200, normed=True) plt.show() </pre> <p> <strong>Output:</strong> </p> <img src=" techcodeview.com img numpy-tutorial numpy-random-python-9.webp' alt="numpy.random in Python"> <p> <strong>19) normal([loc, scale, size])</strong> </p> <p>This function is used to draw sample from a normal distribution.</p> <p> <strong>Example:</strong> </p> <pre> import numpy as np import matplotlib.pyplot as plt mu, sigma = 0, 0.2 # mean and standard deviation s1 = np.random.normal(mu, sigma, 1000) abs(mu - np.mean(s1)) <0.01 1 abs(sigma - np.std(s1, ddof="1))" < 0.01 count, bins, ignored="plt.hist(s1," 30, density="True)" plt.plot(bins, (sigma * np.sqrt(2 np.pi)) *np.exp( (bins mu)**2 (2 sigma**2) ), linewidth="2," color="r" ) plt.show() pre> <p> <strong>Output:</strong> </p> <img src="//techcodeview.com/img/numpy-tutorial/36/numpy-random-python-10.webp" alt="numpy.random in Python"> <p> <strong>20) pareto(a[, size])</strong> </p> <p>This function is used to draw samples from a Lomax or Pareto II with specified shape.</p> <p> <strong>Example:</strong> </p> <pre> import numpy as np import matplotlib.pyplot as plt b, m1 = 3., 2. # shape and mode s1 = (np.random.pareto(b, 1000) + 1) * m1 count, bins, _ = plt.hist(s1, 100, density=True) fit = b*m**b / bins**(b+1) plt.plot(bins, max(count)*fit/max(fit), linewidth=2, color='r') plt.show() </pre> <p> <strong>Output:</strong> </p> <img src="//techcodeview.com/img/numpy-tutorial/36/numpy-random-python-11.webp" alt="numpy.random in Python"> <p> <strong>21) power(a[, size])</strong> </p> <p>This function is used to draw samples in [0, 1] from a power distribution with positive exponent a-1.</p> <p> <strong>Example:</strong> </p> <pre> import numpy as np x = 5. # shape samples = 1000 s1 = np.random.power(x, samples) import matplotlib.pyplot as plt count, bins, ignored = plt.hist(s1, bins=30) a = np.linspace(0, 1, 100) b = x*a**(x-1.) density_b = samples*np.diff(bins)[0]*b plt.plot(a, density_b) plt.show() </pre> <p> <strong>Output:</strong> </p> <img src="//techcodeview.com/img/numpy-tutorial/36/numpy-random-python-12.webp" alt="numpy.random in Python"> <p> <strong>22) rayleigh([scale, size])</strong> </p> <p>This function is used to draw sample from a Rayleigh distribution.</p> <p> <strong>Example:</strong> </p> <pre> val = hist(np.random.rayleigh(3, 100000), bins=200, density=True) meanval = 1 modeval = np.sqrt(2 / np.pi) * meanval s1 = np.random.rayleigh(modeval, 1000000) 100.*sum(s1>3)/1000000. </pre> <p> <strong>Output:</strong> </p> <pre> 0.087300000000000003 </pre> <p><img src="//techcodeview.com/img/numpy-tutorial/36/numpy-random-python-13.webp" alt="numpy.random in Python"></p> <p> <strong>23) standard_cauchy([size])</strong> </p> <p>This function is used to draw sample from a standard Cauchy distribution with mode=0.</p> <p> <strong>Example:</strong> </p> <pre> import numpy as np import matplotlib.pyplot as plt s1 = np.random.standard_cauchy(1000000) s1 = s1[(s1>-25) & (s1<25)] # truncate distribution so it plots well plt.hist(s1, bins="100)" plt.show() < pre> <p> <strong>Output:</strong> </p> <img src="//techcodeview.com/img/numpy-tutorial/36/numpy-random-python-14.webp" alt="numpy.random in Python"> <p> <strong>24) standard_exponential([size])</strong> </p> <p>This function is used to draw sample from a standard exponential distribution.</p> <p> <strong>Example:</strong> </p> <pre> import numpy as np n = np.random.standard_exponential((2, 7000)) </pre> <p> <strong>Output:</strong> </p> <pre> array([[0.53857931, 0.181262 , 0.20478701, ..., 3.66232881, 1.83882709, 1.77963295], [0.65163973, 1.40001955, 0.7525986 , ..., 0.76516523, 0.8400617 , 0.88551011]]) </pre> <p> <strong>25) standard_gamma([size])</strong> </p> <p>This function is used to draw sample from a standard Gamma distribution.</p> <p> <strong>Example:</strong> </p> <pre> import numpy as np shape, scale = 2., 1. s1 = np.random.standard_gamma(shape, 1000000) import matplotlib.pyplot as plt import scipy.special as sps count1, bins1, ignored1 = plt.hist(s, 50, density=True) y = bins1**(shape-1) * ((np.exp(-bins1/scale))/ (sps.gamma(shape) * scale**shape)) plt.plot(bins1, y, linewidth=2, color='r') plt.show() </pre> <p> <strong>Output:</strong> </p> <img src="//techcodeview.com/img/numpy-tutorial/36/numpy-random-python-15.webp" alt="numpy.random in Python"> <p> <strong>26) standard_normal([size])</strong> </p> <p>This function is used to draw sample from a standard Normal distribution.</p> <p> <strong>Example:</strong> </p> <pre> import numpy as np import matplotlib.pyplot as plt s1= np.random.standard_normal(8000) s1 q = np.random.standard_normal(size=(3, 4, 2)) q </pre> <p> <strong>Output:</strong> </p> <pre> array([-3.14907597, 0.95366265, -1.20100026, ..., 3.47180222, 0.9608679 , 0.0774319 ]) array([[[ 1.55635461, -1.29541713], [-1.50534663, -0.02829194], [ 1.03949348, -0.26128132], [ 1.51921798, 0.82136178]], [[-0.4011052 , -0.52458858], [-1.31803814, 0.37415379], [-0.67077365, 0.97447018], [-0.20212115, 0.67840888]], [[ 1.86183474, 0.19946562], [-0.07376021, 0.84599701], [-0.84341386, 0.32081667], [-3.32016062, -1.19029818]]]) </pre> <p> <strong>27) standard_t(df[, size])</strong> </p> <p>This function is used to draw sample from a standard Student's distribution with df degree of freedom.</p> <p> <strong>Example:</strong> </p> <pre> intake = np.array([5260., 5470, 5640, 6180, 6390, 6515, 6805, 7515,8230,8770]) s1 = np.random.standard_t(10, size=100000) np.mean(intake) intake.std(ddof=1) t = (np.mean(intake)-7725)/(intake.std(ddof=1)/np.sqrt(len(intake))) h = plt.hist(s1, bins=100, density=True) np.sum(s1<t) float(len(s1)) plt.show() < pre> <p> <strong>Output:</strong> </p> <pre> 6677.5 1174.1101831694598 0.00864 </pre> <p><img src="//techcodeview.com/img/numpy-tutorial/36/numpy-random-python-16.webp" alt="numpy.random in Python"></p> <p> <strong>28) triangular(left, mode, right[, size])</strong> </p> <p>This function is used to draw sample from a triangular distribution over the interval.</p> <p> <strong>Example:</strong> </p> <pre> import numpy as np import matplotlib.pyplot as plt h = plt.hist(np.random.triangular(-4, 0, 8, 1000000), bins=300,density=True) plt.show() </pre> <p> <strong>Output:</strong> </p> <img src="//techcodeview.com/img/numpy-tutorial/36/numpy-random-python-17.webp" alt="numpy.random in Python"> <p> <strong>29) uniform([low, high, size])</strong> </p> <p>This function is used to draw sample from a uniform distribution.</p> <p> <strong>Example:</strong> </p> <pre> import numpy as np import matplotlib.pyplot as plt s1 = np.random.uniform(-1,0,1000) np.all(s1 >= -1) np.all(s1 <0) count, bins, ignored="plt.hist(s1," 15, density="True)" plt.plot(bins, np.ones_like(bins), linewidth="2," color="r" ) plt.show() < pre> <p> <strong>Output:</strong> </p> <img src="//techcodeview.com/img/numpy-tutorial/36/numpy-random-python-18.webp" alt="numpy.random in Python"> <p> <strong>30) vonmises(m1, m2[, size])</strong> </p> <p>This function is used to draw sample from a von Mises distribution.</p> <p> <strong>Example:</strong> </p> <pre> import numpy as np import matplotlib.pyplot as plt m1, m2 = 0.0, 4.0 s1 = np.random.vonmises(m1, m2, 1000) from scipy.special import i0 plt.hist(s1, 50, density=True) x = np.linspace(-np.pi, np.pi, num=51) y = np.exp(m2*np.cos(x-m1))/(2*np.pi*i0(m2)) plt.plot(x, y, linewidth=2, color='r') plt.show() </pre> <p> <strong>Output:</strong> </p> <img src="//techcodeview.com/img/numpy-tutorial/36/numpy-random-python-19.webp" alt="numpy.random in Python"> <p> <strong>31) wald(mean, scale[, size])</strong> </p> <p>This function is used to draw sample from a Wald, or inverse Gaussian distribution.</p> <p> <strong>Example:</strong> </p> <pre> import numpy as np import matplotlib.pyplot as plt h = plt.hist(np.random.wald(3, 3, 100000), bins=250, density=True) plt.show() </pre> <p> <strong>Output:</strong> </p> <img src="//techcodeview.com/img/numpy-tutorial/36/numpy-random-python-20.webp" alt="numpy.random in Python"> <p> <strong>32) weibull(a[, size])</strong> </p> <p>This function is used to draw sample from a Weibull distribution.</p> <p> <strong>Example:</strong> </p> <pre> import numpy as np import matplotlib.pyplot as plt from scipy import special x=2.0 s=np.random.weibull(x, 1000) a = np.arange(1, 100.)/50. def weib(x, n, a): return (a/n)*(x/n)**np.exp(-(x/n)**a) count, bins, ignored = plt.hist(np.random.weibull(5.,1000)) a= np.arange(1,100.)/50. scale = count.max()/weib(x, 1., 5.).max() scale = count.max()/weib(a, 1., 5.).max() plt.plot(x, weib(x, 1., 5.)*scale) plt.show() </pre> <p> <strong>Output:</strong> </p> <img src="//techcodeview.com/img/numpy-tutorial/36/numpy-random-python-21.webp" alt="numpy.random in Python"> <p> <strong>33) zipf(a[, size])</strong> </p> <p>This function is used to draw sample from a Zipf distribution.</p> <p> <strong>Example:</strong> </p> <pre> import numpy as np import matplotlib.pyplot as plt from scipy import special x=2.0 s=np.random.zipf(x, 1000) count, bins, ignored = plt.hist(s[s<50], 50, density="True)" a="np.arange(1.," 50.) b="a**(-x)" special.zetac(x) plt.plot(a, max(b), linewidth="2," color="r" ) plt.show() < pre> <p> <strong>Output:</strong> </p> <img src="//techcodeview.com/img/numpy-tutorial/36/numpy-random-python-22.webp" alt="numpy.random in Python"> <hr></50],></pre></0)></pre></t)></pre></25)]></pre></0.01></pre></i)></pre></0.05:>
תְפוּקָה:
array([0.00264041, 0.04725478, 0.07140803, 0.19526217, 0.23979 , 0.24023478, 0.63141254, 0.95316446, 1.40281789, 1.68327507])
7) גמא(צורה[, קנה מידה, גודל])
פונקציה זו משמשת לציור מדגם מהתפלגות גמא
דוגמא:
import numpy as np shape, scale = 2., 2. s1 = np.random.gamma(shape, scale, 1000) import matplotlib.pyplot as plt import scipy.special as spss count, bins, ignored = plt.hist(s1, 50, density=True) a = bins**(shape-1)*(np.exp(-bins/scale) / (spss.gamma(shape)*scale**shape)) plt.plot(bins, a, linewidth=2, color='r') plt.show()

8) גיאומטרי(p[, גודל])
פונקציה זו משמשת לציור מדגם מהתפלגות גיאומטרית.
דוגמא:
import numpy as np a = np.random.geometric(p=0.35, size=10000) (a == 1).sum() / 1000
תְפוּקָה:
3.
9) gumbel([loc, scale, size])
פונקציה זו משמשת כדי לצייר מדגם מהתפלגות Gumble.
דוגמא:
import numpy as np lov, scale = 0, 0.2 s1 = np.random.gumbel(loc, scale, 1000) import matplotlib.pyplot as plt count, bins, ignored = plt.hist(s1, 30, density=True) plt.plot(bins, (1/beta)*np.exp(-(bins - loc)/beta)* np.exp( -np.exp( -(bins - loc) /beta) ),linewidth=2, color='r') plt.show()
תְפוּקָה:

10) hypergeometric(ngood, nbad, nsample[, size])
פונקציה זו משמשת לציור מדגם מהתפלגות היפרגיאומטרית.
דוגמא:
import numpy as np good, bad, samp = 100, 2, 10 s1 = np.random.hypergeometric(good, bad, samp, 1000) plt.hist(s1) plt.show()
תְפוּקָה:
(array([ 13., 0., 0., 0., 0., 163., 0., 0., 0., 824.]), array([ 8. , 8.2, 8.4, 8.6, 8.8, 9. , 9.2, 9.4, 9.6, 9.8, 10. ]), <a 10 list of patch objects>) </a>

11) laplace([loc, scale, size])
פונקציה זו משמשת כדי לצייר מדגם מהתפלגות Laplace או כפול מעריכי עם מיקום וקנה מידה מוגדרים.
דוגמא:
import numpy as np location, scale = 0., 2. s = np.random.laplace(location, scale, 10) s
תְפוּקָה:
array([-2.77127948, -1.46401453, -0.03723516, -1.61223942, 2.29590691, 1.74297722, 1.49438411, 0.30325513, -0.15948891, -4.99669747])
12) לוגיסטי ([loc, scale, size])
פונקציה זו משמשת להוצאת מדגם מהפצה לוגיסטית.
דוגמא:
import numpy as np import matplotlib.pyplot as plt location, scale = 10, 1 s1 = np.random.logistic(location, scale, 10000) count, bins, ignored = plt.hist(s1, bins=50) count bins ignored plt.show()
תְפוּקָה:
array([1.000e+00, 1.000e+00, 1.000e+00, 0.000e+00, 1.000e+00, 1.000e+00, 1.000e+00, 5.000e+00, 7.000e+00, 1.100e+01, 1.800e+01, 3.500e+01, 5.300e+01, 6.700e+01, 1.150e+02, 1.780e+02, 2.300e+02, 3.680e+02, 4.910e+02, 6.400e+02, 8.250e+02, 9.100e+02, 9.750e+02, 1.039e+03, 9.280e+02, 8.040e+02, 6.530e+02, 5.240e+02, 3.380e+02, 2.470e+02, 1.650e+02, 1.150e+02, 8.500e+01, 6.400e+01, 3.300e+01, 1.600e+01, 2.400e+01, 1.400e+01, 4.000e+00, 5.000e+00, 2.000e+00, 2.000e+00, 1.000e+00, 1.000e+00, 0.000e+00, 1.000e+00, 0.000e+00, 0.000e+00, 0.000e+00, 1.000e+00]) array([ 0.50643911, 0.91891814, 1.33139717, 1.7438762 , 2.15635523, 2.56883427, 2.9813133 , 3.39379233, 3.80627136, 4.2187504 , 4.63122943, 5.04370846, 5.45618749, 5.86866652, 6.28114556, 6.69362459, 7.10610362, 7.51858265, 7.93106169, 8.34354072, 8.75601975, 9.16849878, 9.58097781, 9.99345685, 10.40593588, 10.81841491, 11.23089394, 11.64337298, 12.05585201, 12.46833104, 12.88081007, 13.2932891 , 13.70576814, 14.11824717, 14.5307262 , 14.94320523, 15.35568427, 15.7681633 , 16.18064233, 16.59312136, 17.00560039, 17.41807943, 17.83055846, 18.24303749, 18.65551652, 19.06799556, 19.48047459, 19.89295362, 20.30543265, 20.71791168, 21.13039072]) <a 50 list of patch objects> </a>

13) lognormal([ממוצע, סיגמא, גודל])
פונקציה זו משמשת לציור מדגם מהתפלגות לוג-נורמלית.
דוגמא:
import numpy as np mu, sigma = 2., 1. s1 = np.random.lognormal(mu, sigma, 1000) import matplotlib.pyplot as plt count, bins, ignored = plt.hist(s1, 100, density=True, ) a = np.linspace(min(bins), max(bins), 10000) pdf = (np.exp(-(np.log(a) - mu)**2 / (2 * sigma**2))/ (a * sigma * np.sqrt(2 * np.pi))) plt.plot(a, pdf, linewidth=2, color='r') plt.axis('tight') plt.show()
תְפוּקָה:

14) logseries(p[, גודל])
פונקציה זו משמשת לציור מדגם מהתפלגות לוגריתמית.
דוגמא:
import numpy as np x = .6 s1 = np.random.logseries(x, 10000) count, bins, ignored = plt.hist(s1) def logseries(k, p): return -p**k/(k*log(1-p)) plt.plot(bins, logseries(bins, x)*count.max()/logseries(bins, a).max(), 'r') plt.show()
תְפוּקָה:

15) multinomial(n, pvals[, size])
פונקציה זו משמשת לציור מדגם מהתפלגות רב-נומית.
דוגמא:
java do while loop
import numpy as np np.random.multinomial(20, [1/6.]*6, size=1)
תְפוּקָה:
array([[4, 2, 5, 5, 3, 1]])
16) multivariate_normal(mean, cov[, size, ...)
פונקציה זו משמשת לציור מדגם מהתפלגות נורמלית רב-משתנית.
דוגמא:
import numpy as np mean = (1, 2) coveriance = [[1, 0], [0, 100]] import matplotlib.pyplot as plt a, b = np.random.multivariate_normal(mean, coveriance, 5000).T plt.plot(a, b, 'x') plt.axis('equal'023 030 ) plt.show()
תְפוּקָה:

17) negative_binomial(n, p[, size])
פונקציה זו משמשת כדי לצייר מדגם מהתפלגות בינומית שלילית.
דוגמא:
import numpy as np s1 = np.random.negative_binomial(1, 0.1, 100000) for i in range(1, 11): probability = sum(s1 <i) 36 100000. print i, \'wells drilled, probability of one success=", probability </pre> <p> <strong>Output:</strong> </p> <pre> 1 wells drilled, probability of one success = 0 2 wells drilled, probability of one success = 0 3 wells drilled, probability of one success = 0 4 wells drilled, probability of one success = 0 5 wells drilled, probability of one success = 0 6 wells drilled, probability of one success = 0 7 wells drilled, probability of one success = 0 8 wells drilled, probability of one success = 0 9 wells drilled, probability of one success = 0 10 wells drilled, probability of one success = 0 </pre> <p > <strong>18) noncentral_chisquare(df, nonc[, size])</strong> </p> <p>This function is used to draw sample from a noncentral chi-square distribution. </p> <p> <strong>Example:</strong> </p> <pre> import numpy as np import matplotlib.pyplot as plt val = plt.hist(np.random.noncentral_chisquare(3, 25, 100000), bins=200, normed=True) plt.show() </pre> <p> <strong>Output:</strong> </p> <img src=" techcodeview.com img numpy-tutorial numpy-random-python-9.webp\' alt="numpy.random in Python"> <p> <strong>19) normal([loc, scale, size])</strong> </p> <p>This function is used to draw sample from a normal distribution.</p> <p> <strong>Example:</strong> </p> <pre> import numpy as np import matplotlib.pyplot as plt mu, sigma = 0, 0.2 # mean and standard deviation s1 = np.random.normal(mu, sigma, 1000) abs(mu - np.mean(s1)) <0.01 1 abs(sigma - np.std(s1, ddof="1))" < 0.01 count, bins, ignored="plt.hist(s1," 30, density="True)" plt.plot(bins, (sigma * np.sqrt(2 np.pi)) *np.exp( (bins mu)**2 (2 sigma**2) ), linewidth="2," color="r" ) plt.show() pre> <p> <strong>Output:</strong> </p> <img src="//techcodeview.com/img/numpy-tutorial/36/numpy-random-python-10.webp" alt="numpy.random in Python"> <p> <strong>20) pareto(a[, size])</strong> </p> <p>This function is used to draw samples from a Lomax or Pareto II with specified shape.</p> <p> <strong>Example:</strong> </p> <pre> import numpy as np import matplotlib.pyplot as plt b, m1 = 3., 2. # shape and mode s1 = (np.random.pareto(b, 1000) + 1) * m1 count, bins, _ = plt.hist(s1, 100, density=True) fit = b*m**b / bins**(b+1) plt.plot(bins, max(count)*fit/max(fit), linewidth=2, color='r') plt.show() </pre> <p> <strong>Output:</strong> </p> <img src="//techcodeview.com/img/numpy-tutorial/36/numpy-random-python-11.webp" alt="numpy.random in Python"> <p> <strong>21) power(a[, size])</strong> </p> <p>This function is used to draw samples in [0, 1] from a power distribution with positive exponent a-1.</p> <p> <strong>Example:</strong> </p> <pre> import numpy as np x = 5. # shape samples = 1000 s1 = np.random.power(x, samples) import matplotlib.pyplot as plt count, bins, ignored = plt.hist(s1, bins=30) a = np.linspace(0, 1, 100) b = x*a**(x-1.) density_b = samples*np.diff(bins)[0]*b plt.plot(a, density_b) plt.show() </pre> <p> <strong>Output:</strong> </p> <img src="//techcodeview.com/img/numpy-tutorial/36/numpy-random-python-12.webp" alt="numpy.random in Python"> <p> <strong>22) rayleigh([scale, size])</strong> </p> <p>This function is used to draw sample from a Rayleigh distribution.</p> <p> <strong>Example:</strong> </p> <pre> val = hist(np.random.rayleigh(3, 100000), bins=200, density=True) meanval = 1 modeval = np.sqrt(2 / np.pi) * meanval s1 = np.random.rayleigh(modeval, 1000000) 100.*sum(s1>3)/1000000. </pre> <p> <strong>Output:</strong> </p> <pre> 0.087300000000000003 </pre> <p><img src="//techcodeview.com/img/numpy-tutorial/36/numpy-random-python-13.webp" alt="numpy.random in Python"></p> <p> <strong>23) standard_cauchy([size])</strong> </p> <p>This function is used to draw sample from a standard Cauchy distribution with mode=0.</p> <p> <strong>Example:</strong> </p> <pre> import numpy as np import matplotlib.pyplot as plt s1 = np.random.standard_cauchy(1000000) s1 = s1[(s1>-25) & (s1<25)] # truncate distribution so it plots well plt.hist(s1, bins="100)" plt.show() < pre> <p> <strong>Output:</strong> </p> <img src="//techcodeview.com/img/numpy-tutorial/36/numpy-random-python-14.webp" alt="numpy.random in Python"> <p> <strong>24) standard_exponential([size])</strong> </p> <p>This function is used to draw sample from a standard exponential distribution.</p> <p> <strong>Example:</strong> </p> <pre> import numpy as np n = np.random.standard_exponential((2, 7000)) </pre> <p> <strong>Output:</strong> </p> <pre> array([[0.53857931, 0.181262 , 0.20478701, ..., 3.66232881, 1.83882709, 1.77963295], [0.65163973, 1.40001955, 0.7525986 , ..., 0.76516523, 0.8400617 , 0.88551011]]) </pre> <p> <strong>25) standard_gamma([size])</strong> </p> <p>This function is used to draw sample from a standard Gamma distribution.</p> <p> <strong>Example:</strong> </p> <pre> import numpy as np shape, scale = 2., 1. s1 = np.random.standard_gamma(shape, 1000000) import matplotlib.pyplot as plt import scipy.special as sps count1, bins1, ignored1 = plt.hist(s, 50, density=True) y = bins1**(shape-1) * ((np.exp(-bins1/scale))/ (sps.gamma(shape) * scale**shape)) plt.plot(bins1, y, linewidth=2, color='r') plt.show() </pre> <p> <strong>Output:</strong> </p> <img src="//techcodeview.com/img/numpy-tutorial/36/numpy-random-python-15.webp" alt="numpy.random in Python"> <p> <strong>26) standard_normal([size])</strong> </p> <p>This function is used to draw sample from a standard Normal distribution.</p> <p> <strong>Example:</strong> </p> <pre> import numpy as np import matplotlib.pyplot as plt s1= np.random.standard_normal(8000) s1 q = np.random.standard_normal(size=(3, 4, 2)) q </pre> <p> <strong>Output:</strong> </p> <pre> array([-3.14907597, 0.95366265, -1.20100026, ..., 3.47180222, 0.9608679 , 0.0774319 ]) array([[[ 1.55635461, -1.29541713], [-1.50534663, -0.02829194], [ 1.03949348, -0.26128132], [ 1.51921798, 0.82136178]], [[-0.4011052 , -0.52458858], [-1.31803814, 0.37415379], [-0.67077365, 0.97447018], [-0.20212115, 0.67840888]], [[ 1.86183474, 0.19946562], [-0.07376021, 0.84599701], [-0.84341386, 0.32081667], [-3.32016062, -1.19029818]]]) </pre> <p> <strong>27) standard_t(df[, size])</strong> </p> <p>This function is used to draw sample from a standard Student's distribution with df degree of freedom.</p> <p> <strong>Example:</strong> </p> <pre> intake = np.array([5260., 5470, 5640, 6180, 6390, 6515, 6805, 7515,8230,8770]) s1 = np.random.standard_t(10, size=100000) np.mean(intake) intake.std(ddof=1) t = (np.mean(intake)-7725)/(intake.std(ddof=1)/np.sqrt(len(intake))) h = plt.hist(s1, bins=100, density=True) np.sum(s1<t) float(len(s1)) plt.show() < pre> <p> <strong>Output:</strong> </p> <pre> 6677.5 1174.1101831694598 0.00864 </pre> <p><img src="//techcodeview.com/img/numpy-tutorial/36/numpy-random-python-16.webp" alt="numpy.random in Python"></p> <p> <strong>28) triangular(left, mode, right[, size])</strong> </p> <p>This function is used to draw sample from a triangular distribution over the interval.</p> <p> <strong>Example:</strong> </p> <pre> import numpy as np import matplotlib.pyplot as plt h = plt.hist(np.random.triangular(-4, 0, 8, 1000000), bins=300,density=True) plt.show() </pre> <p> <strong>Output:</strong> </p> <img src="//techcodeview.com/img/numpy-tutorial/36/numpy-random-python-17.webp" alt="numpy.random in Python"> <p> <strong>29) uniform([low, high, size])</strong> </p> <p>This function is used to draw sample from a uniform distribution.</p> <p> <strong>Example:</strong> </p> <pre> import numpy as np import matplotlib.pyplot as plt s1 = np.random.uniform(-1,0,1000) np.all(s1 >= -1) np.all(s1 <0) count, bins, ignored="plt.hist(s1," 15, density="True)" plt.plot(bins, np.ones_like(bins), linewidth="2," color="r" ) plt.show() < pre> <p> <strong>Output:</strong> </p> <img src="//techcodeview.com/img/numpy-tutorial/36/numpy-random-python-18.webp" alt="numpy.random in Python"> <p> <strong>30) vonmises(m1, m2[, size])</strong> </p> <p>This function is used to draw sample from a von Mises distribution.</p> <p> <strong>Example:</strong> </p> <pre> import numpy as np import matplotlib.pyplot as plt m1, m2 = 0.0, 4.0 s1 = np.random.vonmises(m1, m2, 1000) from scipy.special import i0 plt.hist(s1, 50, density=True) x = np.linspace(-np.pi, np.pi, num=51) y = np.exp(m2*np.cos(x-m1))/(2*np.pi*i0(m2)) plt.plot(x, y, linewidth=2, color='r') plt.show() </pre> <p> <strong>Output:</strong> </p> <img src="//techcodeview.com/img/numpy-tutorial/36/numpy-random-python-19.webp" alt="numpy.random in Python"> <p> <strong>31) wald(mean, scale[, size])</strong> </p> <p>This function is used to draw sample from a Wald, or inverse Gaussian distribution.</p> <p> <strong>Example:</strong> </p> <pre> import numpy as np import matplotlib.pyplot as plt h = plt.hist(np.random.wald(3, 3, 100000), bins=250, density=True) plt.show() </pre> <p> <strong>Output:</strong> </p> <img src="//techcodeview.com/img/numpy-tutorial/36/numpy-random-python-20.webp" alt="numpy.random in Python"> <p> <strong>32) weibull(a[, size])</strong> </p> <p>This function is used to draw sample from a Weibull distribution.</p> <p> <strong>Example:</strong> </p> <pre> import numpy as np import matplotlib.pyplot as plt from scipy import special x=2.0 s=np.random.weibull(x, 1000) a = np.arange(1, 100.)/50. def weib(x, n, a): return (a/n)*(x/n)**np.exp(-(x/n)**a) count, bins, ignored = plt.hist(np.random.weibull(5.,1000)) a= np.arange(1,100.)/50. scale = count.max()/weib(x, 1., 5.).max() scale = count.max()/weib(a, 1., 5.).max() plt.plot(x, weib(x, 1., 5.)*scale) plt.show() </pre> <p> <strong>Output:</strong> </p> <img src="//techcodeview.com/img/numpy-tutorial/36/numpy-random-python-21.webp" alt="numpy.random in Python"> <p> <strong>33) zipf(a[, size])</strong> </p> <p>This function is used to draw sample from a Zipf distribution.</p> <p> <strong>Example:</strong> </p> <pre> import numpy as np import matplotlib.pyplot as plt from scipy import special x=2.0 s=np.random.zipf(x, 1000) count, bins, ignored = plt.hist(s[s<50], 50, density="True)" a="np.arange(1.," 50.) b="a**(-x)" special.zetac(x) plt.plot(a, max(b), linewidth="2," color="r" ) plt.show() < pre> <p> <strong>Output:</strong> </p> <img src="//techcodeview.com/img/numpy-tutorial/36/numpy-random-python-22.webp" alt="numpy.random in Python"> <hr></50],></pre></0)></pre></t)></pre></25)]></pre></0.01></pre></i)>
תְפוּקָה:

21) power(a[, גודל])
פונקציה זו משמשת לשרטוט דגימות ב-[0, 1] מחלוקת כוח עם מעריך חיובי a-1.
דוגמא:
import numpy as np x = 5. # shape samples = 1000 s1 = np.random.power(x, samples) import matplotlib.pyplot as plt count, bins, ignored = plt.hist(s1, bins=30) a = np.linspace(0, 1, 100) b = x*a**(x-1.) density_b = samples*np.diff(bins)[0]*b plt.plot(a, density_b) plt.show()
תְפוּקָה:

22) rayleigh([קנה מידה, גודל])
פונקציה זו משמשת לציור מדגם מהתפלגות ריילי.
דוגמא:
val = hist(np.random.rayleigh(3, 100000), bins=200, density=True) meanval = 1 modeval = np.sqrt(2 / np.pi) * meanval s1 = np.random.rayleigh(modeval, 1000000) 100.*sum(s1>3)/1000000.
תְפוּקָה:
0.087300000000000003

23) standard_cauchy([גודל])
פונקציה זו משמשת כדי לצייר מדגם מהתפלגות Cauchy סטנדרטית עם mode=0.
דוגמא:
import numpy as np import matplotlib.pyplot as plt s1 = np.random.standard_cauchy(1000000) s1 = s1[(s1>-25) & (s1<25)] # truncate distribution so it plots well plt.hist(s1, bins="100)" plt.show() < pre> <p> <strong>Output:</strong> </p> <img src="//techcodeview.com/img/numpy-tutorial/36/numpy-random-python-14.webp" alt="numpy.random in Python"> <p> <strong>24) standard_exponential([size])</strong> </p> <p>This function is used to draw sample from a standard exponential distribution.</p> <p> <strong>Example:</strong> </p> <pre> import numpy as np n = np.random.standard_exponential((2, 7000)) </pre> <p> <strong>Output:</strong> </p> <pre> array([[0.53857931, 0.181262 , 0.20478701, ..., 3.66232881, 1.83882709, 1.77963295], [0.65163973, 1.40001955, 0.7525986 , ..., 0.76516523, 0.8400617 , 0.88551011]]) </pre> <p> <strong>25) standard_gamma([size])</strong> </p> <p>This function is used to draw sample from a standard Gamma distribution.</p> <p> <strong>Example:</strong> </p> <pre> import numpy as np shape, scale = 2., 1. s1 = np.random.standard_gamma(shape, 1000000) import matplotlib.pyplot as plt import scipy.special as sps count1, bins1, ignored1 = plt.hist(s, 50, density=True) y = bins1**(shape-1) * ((np.exp(-bins1/scale))/ (sps.gamma(shape) * scale**shape)) plt.plot(bins1, y, linewidth=2, color='r') plt.show() </pre> <p> <strong>Output:</strong> </p> <img src="//techcodeview.com/img/numpy-tutorial/36/numpy-random-python-15.webp" alt="numpy.random in Python"> <p> <strong>26) standard_normal([size])</strong> </p> <p>This function is used to draw sample from a standard Normal distribution.</p> <p> <strong>Example:</strong> </p> <pre> import numpy as np import matplotlib.pyplot as plt s1= np.random.standard_normal(8000) s1 q = np.random.standard_normal(size=(3, 4, 2)) q </pre> <p> <strong>Output:</strong> </p> <pre> array([-3.14907597, 0.95366265, -1.20100026, ..., 3.47180222, 0.9608679 , 0.0774319 ]) array([[[ 1.55635461, -1.29541713], [-1.50534663, -0.02829194], [ 1.03949348, -0.26128132], [ 1.51921798, 0.82136178]], [[-0.4011052 , -0.52458858], [-1.31803814, 0.37415379], [-0.67077365, 0.97447018], [-0.20212115, 0.67840888]], [[ 1.86183474, 0.19946562], [-0.07376021, 0.84599701], [-0.84341386, 0.32081667], [-3.32016062, -1.19029818]]]) </pre> <p> <strong>27) standard_t(df[, size])</strong> </p> <p>This function is used to draw sample from a standard Student's distribution with df degree of freedom.</p> <p> <strong>Example:</strong> </p> <pre> intake = np.array([5260., 5470, 5640, 6180, 6390, 6515, 6805, 7515,8230,8770]) s1 = np.random.standard_t(10, size=100000) np.mean(intake) intake.std(ddof=1) t = (np.mean(intake)-7725)/(intake.std(ddof=1)/np.sqrt(len(intake))) h = plt.hist(s1, bins=100, density=True) np.sum(s1<t) float(len(s1)) plt.show() < pre> <p> <strong>Output:</strong> </p> <pre> 6677.5 1174.1101831694598 0.00864 </pre> <p><img src="//techcodeview.com/img/numpy-tutorial/36/numpy-random-python-16.webp" alt="numpy.random in Python"></p> <p> <strong>28) triangular(left, mode, right[, size])</strong> </p> <p>This function is used to draw sample from a triangular distribution over the interval.</p> <p> <strong>Example:</strong> </p> <pre> import numpy as np import matplotlib.pyplot as plt h = plt.hist(np.random.triangular(-4, 0, 8, 1000000), bins=300,density=True) plt.show() </pre> <p> <strong>Output:</strong> </p> <img src="//techcodeview.com/img/numpy-tutorial/36/numpy-random-python-17.webp" alt="numpy.random in Python"> <p> <strong>29) uniform([low, high, size])</strong> </p> <p>This function is used to draw sample from a uniform distribution.</p> <p> <strong>Example:</strong> </p> <pre> import numpy as np import matplotlib.pyplot as plt s1 = np.random.uniform(-1,0,1000) np.all(s1 >= -1) np.all(s1 <0) count, bins, ignored="plt.hist(s1," 15, density="True)" plt.plot(bins, np.ones_like(bins), linewidth="2," color="r" ) plt.show() < pre> <p> <strong>Output:</strong> </p> <img src="//techcodeview.com/img/numpy-tutorial/36/numpy-random-python-18.webp" alt="numpy.random in Python"> <p> <strong>30) vonmises(m1, m2[, size])</strong> </p> <p>This function is used to draw sample from a von Mises distribution.</p> <p> <strong>Example:</strong> </p> <pre> import numpy as np import matplotlib.pyplot as plt m1, m2 = 0.0, 4.0 s1 = np.random.vonmises(m1, m2, 1000) from scipy.special import i0 plt.hist(s1, 50, density=True) x = np.linspace(-np.pi, np.pi, num=51) y = np.exp(m2*np.cos(x-m1))/(2*np.pi*i0(m2)) plt.plot(x, y, linewidth=2, color='r') plt.show() </pre> <p> <strong>Output:</strong> </p> <img src="//techcodeview.com/img/numpy-tutorial/36/numpy-random-python-19.webp" alt="numpy.random in Python"> <p> <strong>31) wald(mean, scale[, size])</strong> </p> <p>This function is used to draw sample from a Wald, or inverse Gaussian distribution.</p> <p> <strong>Example:</strong> </p> <pre> import numpy as np import matplotlib.pyplot as plt h = plt.hist(np.random.wald(3, 3, 100000), bins=250, density=True) plt.show() </pre> <p> <strong>Output:</strong> </p> <img src="//techcodeview.com/img/numpy-tutorial/36/numpy-random-python-20.webp" alt="numpy.random in Python"> <p> <strong>32) weibull(a[, size])</strong> </p> <p>This function is used to draw sample from a Weibull distribution.</p> <p> <strong>Example:</strong> </p> <pre> import numpy as np import matplotlib.pyplot as plt from scipy import special x=2.0 s=np.random.weibull(x, 1000) a = np.arange(1, 100.)/50. def weib(x, n, a): return (a/n)*(x/n)**np.exp(-(x/n)**a) count, bins, ignored = plt.hist(np.random.weibull(5.,1000)) a= np.arange(1,100.)/50. scale = count.max()/weib(x, 1., 5.).max() scale = count.max()/weib(a, 1., 5.).max() plt.plot(x, weib(x, 1., 5.)*scale) plt.show() </pre> <p> <strong>Output:</strong> </p> <img src="//techcodeview.com/img/numpy-tutorial/36/numpy-random-python-21.webp" alt="numpy.random in Python"> <p> <strong>33) zipf(a[, size])</strong> </p> <p>This function is used to draw sample from a Zipf distribution.</p> <p> <strong>Example:</strong> </p> <pre> import numpy as np import matplotlib.pyplot as plt from scipy import special x=2.0 s=np.random.zipf(x, 1000) count, bins, ignored = plt.hist(s[s<50], 50, density="True)" a="np.arange(1.," 50.) b="a**(-x)" special.zetac(x) plt.plot(a, max(b), linewidth="2," color="r" ) plt.show() < pre> <p> <strong>Output:</strong> </p> <img src="//techcodeview.com/img/numpy-tutorial/36/numpy-random-python-22.webp" alt="numpy.random in Python"> <hr></50],></pre></0)></pre></t)></pre></25)]>
תְפוּקָה:
array([[0.53857931, 0.181262 , 0.20478701, ..., 3.66232881, 1.83882709, 1.77963295], [0.65163973, 1.40001955, 0.7525986 , ..., 0.76516523, 0.8400617 , 0.88551011]])
25) standard_gamma([גודל])
פונקציה זו משמשת לציור מדגם מהתפלגות גמא סטנדרטית.
דוגמא:
import numpy as np shape, scale = 2., 1. s1 = np.random.standard_gamma(shape, 1000000) import matplotlib.pyplot as plt import scipy.special as sps count1, bins1, ignored1 = plt.hist(s, 50, density=True) y = bins1**(shape-1) * ((np.exp(-bins1/scale))/ (sps.gamma(shape) * scale**shape)) plt.plot(bins1, y, linewidth=2, color='r') plt.show()
תְפוּקָה:

26) standard_normal([size])
פונקציה זו משמשת לציור מדגם מהתפלגות נורמלית סטנדרטית.
דוגמא:
import numpy as np import matplotlib.pyplot as plt s1= np.random.standard_normal(8000) s1 q = np.random.standard_normal(size=(3, 4, 2)) q
תְפוּקָה:
array([-3.14907597, 0.95366265, -1.20100026, ..., 3.47180222, 0.9608679 , 0.0774319 ]) array([[[ 1.55635461, -1.29541713], [-1.50534663, -0.02829194], [ 1.03949348, -0.26128132], [ 1.51921798, 0.82136178]], [[-0.4011052 , -0.52458858], [-1.31803814, 0.37415379], [-0.67077365, 0.97447018], [-0.20212115, 0.67840888]], [[ 1.86183474, 0.19946562], [-0.07376021, 0.84599701], [-0.84341386, 0.32081667], [-3.32016062, -1.19029818]]])
27) standard_t(df[, size])
פונקציה זו משמשת כדי לצייר מדגם מהתפלגות סטנדרטית של Student עם דרגת חופש df.
דוגמא:
intake = np.array([5260., 5470, 5640, 6180, 6390, 6515, 6805, 7515,8230,8770]) s1 = np.random.standard_t(10, size=100000) np.mean(intake) intake.std(ddof=1) t = (np.mean(intake)-7725)/(intake.std(ddof=1)/np.sqrt(len(intake))) h = plt.hist(s1, bins=100, density=True) np.sum(s1<t) float(len(s1)) plt.show() < pre> <p> <strong>Output:</strong> </p> <pre> 6677.5 1174.1101831694598 0.00864 </pre> <p><img src="//techcodeview.com/img/numpy-tutorial/36/numpy-random-python-16.webp" alt="numpy.random in Python"></p> <p> <strong>28) triangular(left, mode, right[, size])</strong> </p> <p>This function is used to draw sample from a triangular distribution over the interval.</p> <p> <strong>Example:</strong> </p> <pre> import numpy as np import matplotlib.pyplot as plt h = plt.hist(np.random.triangular(-4, 0, 8, 1000000), bins=300,density=True) plt.show() </pre> <p> <strong>Output:</strong> </p> <img src="//techcodeview.com/img/numpy-tutorial/36/numpy-random-python-17.webp" alt="numpy.random in Python"> <p> <strong>29) uniform([low, high, size])</strong> </p> <p>This function is used to draw sample from a uniform distribution.</p> <p> <strong>Example:</strong> </p> <pre> import numpy as np import matplotlib.pyplot as plt s1 = np.random.uniform(-1,0,1000) np.all(s1 >= -1) np.all(s1 <0) count, bins, ignored="plt.hist(s1," 15, density="True)" plt.plot(bins, np.ones_like(bins), linewidth="2," color="r" ) plt.show() < pre> <p> <strong>Output:</strong> </p> <img src="//techcodeview.com/img/numpy-tutorial/36/numpy-random-python-18.webp" alt="numpy.random in Python"> <p> <strong>30) vonmises(m1, m2[, size])</strong> </p> <p>This function is used to draw sample from a von Mises distribution.</p> <p> <strong>Example:</strong> </p> <pre> import numpy as np import matplotlib.pyplot as plt m1, m2 = 0.0, 4.0 s1 = np.random.vonmises(m1, m2, 1000) from scipy.special import i0 plt.hist(s1, 50, density=True) x = np.linspace(-np.pi, np.pi, num=51) y = np.exp(m2*np.cos(x-m1))/(2*np.pi*i0(m2)) plt.plot(x, y, linewidth=2, color='r') plt.show() </pre> <p> <strong>Output:</strong> </p> <img src="//techcodeview.com/img/numpy-tutorial/36/numpy-random-python-19.webp" alt="numpy.random in Python"> <p> <strong>31) wald(mean, scale[, size])</strong> </p> <p>This function is used to draw sample from a Wald, or inverse Gaussian distribution.</p> <p> <strong>Example:</strong> </p> <pre> import numpy as np import matplotlib.pyplot as plt h = plt.hist(np.random.wald(3, 3, 100000), bins=250, density=True) plt.show() </pre> <p> <strong>Output:</strong> </p> <img src="//techcodeview.com/img/numpy-tutorial/36/numpy-random-python-20.webp" alt="numpy.random in Python"> <p> <strong>32) weibull(a[, size])</strong> </p> <p>This function is used to draw sample from a Weibull distribution.</p> <p> <strong>Example:</strong> </p> <pre> import numpy as np import matplotlib.pyplot as plt from scipy import special x=2.0 s=np.random.weibull(x, 1000) a = np.arange(1, 100.)/50. def weib(x, n, a): return (a/n)*(x/n)**np.exp(-(x/n)**a) count, bins, ignored = plt.hist(np.random.weibull(5.,1000)) a= np.arange(1,100.)/50. scale = count.max()/weib(x, 1., 5.).max() scale = count.max()/weib(a, 1., 5.).max() plt.plot(x, weib(x, 1., 5.)*scale) plt.show() </pre> <p> <strong>Output:</strong> </p> <img src="//techcodeview.com/img/numpy-tutorial/36/numpy-random-python-21.webp" alt="numpy.random in Python"> <p> <strong>33) zipf(a[, size])</strong> </p> <p>This function is used to draw sample from a Zipf distribution.</p> <p> <strong>Example:</strong> </p> <pre> import numpy as np import matplotlib.pyplot as plt from scipy import special x=2.0 s=np.random.zipf(x, 1000) count, bins, ignored = plt.hist(s[s<50], 50, density="True)" a="np.arange(1.," 50.) b="a**(-x)" special.zetac(x) plt.plot(a, max(b), linewidth="2," color="r" ) plt.show() < pre> <p> <strong>Output:</strong> </p> <img src="//techcodeview.com/img/numpy-tutorial/36/numpy-random-python-22.webp" alt="numpy.random in Python"> <hr></50],></pre></0)></pre></t)>

28) משולש(שמאל, מצב, ימין[, גודל])
פונקציה זו משמשת לציור מדגם מהתפלגות משולשת על פני המרווח.
דוגמא:
import numpy as np import matplotlib.pyplot as plt h = plt.hist(np.random.triangular(-4, 0, 8, 1000000), bins=300,density=True) plt.show()
תְפוּקָה:

29) אחיד([נמוך, גבוה, מידה])
פונקציה זו משמשת לציור מדגם מהתפלגות אחידה.
דוגמא:
import numpy as np import matplotlib.pyplot as plt s1 = np.random.uniform(-1,0,1000) np.all(s1 >= -1) np.all(s1 <0) count, bins, ignored="plt.hist(s1," 15, density="True)" plt.plot(bins, np.ones_like(bins), linewidth="2," color="r" ) plt.show() < pre> <p> <strong>Output:</strong> </p> <img src="//techcodeview.com/img/numpy-tutorial/36/numpy-random-python-18.webp" alt="numpy.random in Python"> <p> <strong>30) vonmises(m1, m2[, size])</strong> </p> <p>This function is used to draw sample from a von Mises distribution.</p> <p> <strong>Example:</strong> </p> <pre> import numpy as np import matplotlib.pyplot as plt m1, m2 = 0.0, 4.0 s1 = np.random.vonmises(m1, m2, 1000) from scipy.special import i0 plt.hist(s1, 50, density=True) x = np.linspace(-np.pi, np.pi, num=51) y = np.exp(m2*np.cos(x-m1))/(2*np.pi*i0(m2)) plt.plot(x, y, linewidth=2, color='r') plt.show() </pre> <p> <strong>Output:</strong> </p> <img src="//techcodeview.com/img/numpy-tutorial/36/numpy-random-python-19.webp" alt="numpy.random in Python"> <p> <strong>31) wald(mean, scale[, size])</strong> </p> <p>This function is used to draw sample from a Wald, or inverse Gaussian distribution.</p> <p> <strong>Example:</strong> </p> <pre> import numpy as np import matplotlib.pyplot as plt h = plt.hist(np.random.wald(3, 3, 100000), bins=250, density=True) plt.show() </pre> <p> <strong>Output:</strong> </p> <img src="//techcodeview.com/img/numpy-tutorial/36/numpy-random-python-20.webp" alt="numpy.random in Python"> <p> <strong>32) weibull(a[, size])</strong> </p> <p>This function is used to draw sample from a Weibull distribution.</p> <p> <strong>Example:</strong> </p> <pre> import numpy as np import matplotlib.pyplot as plt from scipy import special x=2.0 s=np.random.weibull(x, 1000) a = np.arange(1, 100.)/50. def weib(x, n, a): return (a/n)*(x/n)**np.exp(-(x/n)**a) count, bins, ignored = plt.hist(np.random.weibull(5.,1000)) a= np.arange(1,100.)/50. scale = count.max()/weib(x, 1., 5.).max() scale = count.max()/weib(a, 1., 5.).max() plt.plot(x, weib(x, 1., 5.)*scale) plt.show() </pre> <p> <strong>Output:</strong> </p> <img src="//techcodeview.com/img/numpy-tutorial/36/numpy-random-python-21.webp" alt="numpy.random in Python"> <p> <strong>33) zipf(a[, size])</strong> </p> <p>This function is used to draw sample from a Zipf distribution.</p> <p> <strong>Example:</strong> </p> <pre> import numpy as np import matplotlib.pyplot as plt from scipy import special x=2.0 s=np.random.zipf(x, 1000) count, bins, ignored = plt.hist(s[s<50], 50, density="True)" a="np.arange(1.," 50.) b="a**(-x)" special.zetac(x) plt.plot(a, max(b), linewidth="2," color="r" ) plt.show() < pre> <p> <strong>Output:</strong> </p> <img src="//techcodeview.com/img/numpy-tutorial/36/numpy-random-python-22.webp" alt="numpy.random in Python"> <hr></50],></pre></0)>
תְפוּקָה:

31) wald(ממוצע, קנה מידה[, גודל])
פונקציה זו משמשת כדי לצייר מדגם מ-Wald, או התפלגות גאוס הפוכה.
דוגמא:
import numpy as np import matplotlib.pyplot as plt h = plt.hist(np.random.wald(3, 3, 100000), bins=250, density=True) plt.show()
תְפוּקָה:

32) weibull(a[, גודל])
פונקציה זו משמשת כדי לצייר מדגם מהתפלגות Weibull.
דוגמא:
import numpy as np import matplotlib.pyplot as plt from scipy import special x=2.0 s=np.random.weibull(x, 1000) a = np.arange(1, 100.)/50. def weib(x, n, a): return (a/n)*(x/n)**np.exp(-(x/n)**a) count, bins, ignored = plt.hist(np.random.weibull(5.,1000)) a= np.arange(1,100.)/50. scale = count.max()/weib(x, 1., 5.).max() scale = count.max()/weib(a, 1., 5.).max() plt.plot(x, weib(x, 1., 5.)*scale) plt.show()
תְפוּקָה:

33) zipf(a[, size])
פונקציה זו משמשת לציור מדגם מהתפלגות Zipf.
דוגמא:
import numpy as np import matplotlib.pyplot as plt from scipy import special x=2.0 s=np.random.zipf(x, 1000) count, bins, ignored = plt.hist(s[s<50], 50, density="True)" a="np.arange(1.," 50.) b="a**(-x)" special.zetac(x) plt.plot(a, max(b), linewidth="2," color="r" ) plt.show() < pre> <p> <strong>Output:</strong> </p> <img src="//techcodeview.com/img/numpy-tutorial/36/numpy-random-python-22.webp" alt="numpy.random in Python"> <hr></50],>